Hardware Documentation
Cortex-M Overview
- Cortex-M for Beginners – 2017_EN_v2
- Well-organized list of Cortex-M Resources
CPU Core: ARM Cortex-M0+
- Introducing the Cortex-M0+ Processor: The Ultimate in Low Power
- Cortex-M0+ Device Generic User Guide – DUI0662B_cortex_m0p_r0p1_dgug
- Cortex-M0+ Technical Reference Manual – DDI0484B_CORTEX_M0P_R0P0_TRM
- DDI0419C_arm_architecture_v6m_reference_manual
MCU: NXP KL25Z128
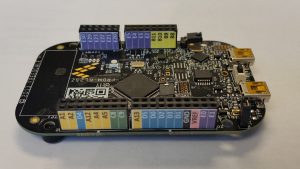
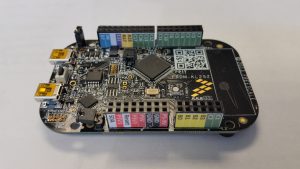
Development Board: NXP FRDM-KL25Z
- FRDM-KL25Z User’s Manual (Rev 2)
- FRDM-KL25Z and OpenSDA Overview (v5)
- FRDM-KL25Z Pinouts (Rev 1.0)
- Schematic SPF-27556_E
- RGB LED: CLV1AFKB(874)
- Inertial Sensor (Accelerometer)
- Datasheets: MMA8451Q rev10, MMA8451Q rev7.1
- Application Notes: AN4076 AN4069 AN4070 AN4071
- Voltage Regulator: NCP1117-D
Expansion Shield
- Design
- Freedom-KL25Z Shield v14 Hardware Manual (1/19/2025)
- Shield V14 Schematic and Shield V14 PCB layout
- Components
- HBLED XlampMLE, XLamp_EyeSafety
- LCD module NHD-2.4-240320CF-CTXI-FT and controller ST7789S
- Connector J3 62684
- Audio Amplifier IS31AP4991A_DS
- microSD Card
- SD Card Specification v8
- Example SD Card datasheet from Kingston
- SMPS
- Gate driver buffer sn74lvc1g04
- Inductor SDR0604
- Capacitors mlcc01_e
- Transistors Infineon-BSS215P-DS-v02_03-en , ao3416 or AO3420
- Diode rb550vm-30te-17-e, was DB2J209_E
- Designs for 3D-printed components at Tinkercad
Software Documentation
Arm ISA References
Tools
MDK-ARM
- Options for running on a Mac
- For Mac OSX use Virtual Box: https://www.virtualbox.org/
- Then load Windows (assuming you have an installable DVD or ISO file).
- Then allow your Windows Virtual Machine to access the Mac’s USB port.
- For M1 and M2 Macs use Parallels. https://apps.apple.com/dk/app/parallels-desktop/id1085114709?mt=12 It does need a subscription for more than the trial period.
- Run the Windows 11 VM.
- Also, It only works on one of the USB ports. You may need to try them all.
- For Intel Macs use Bootcamp: https://support.apple.com/en-us/HT201468
- For Mac OSX use Virtual Box: https://www.virtualbox.org/
- CMSIS-Pack Overview, Device Family Pack, peeking inside
Waveforms + Analog Discovery 2/3: Visualizing Code Timing with Debug Signals
- Instructions on Visualizing Code Timing using debug signals, Analog Discovery tool and Waveforms program.
- MDK-ARM Demonstration project with Waveforms workspace is on class repository in Tools\TestCode\DebugSignals.
Ghidra Software Reverse-Engineering Tool
- Home page
- Installation guide
- Download the latest zip file from github (e.g. Ghidra 11.2.1 -> Assets -> ghidra_….zip)
- You may need to install a newer version of the JDK.
- You can find all the copies of java.exe on your PC by opening a CMD window and typing where java.exe. The path should indicate the java version number.
- See the Installation Guide for details and links to installers for newer versions (e.g. Adoptium Temurin and Amazon Corretto).
- Note: if you put the Ghidra directory in Program Files, then you’ll need to run Ghidra with Administrator privileges. It’s better to put it in Users\<your_login>\Ghidra.
- Cheat sheet with command shortcuts
- Development links
- Ghidra Snippets: Python examples using Ghidra APIs
- Ghidrathon: Ghidra with Python 3 Scripting
Create New Project
- File->New Project (Ctl-N)
- Non-Shared Project, Next
- Select the project directory (change if needed) and create a name for the project. Click Finish.
- Click on green Ghidra head in Tool Chest (upper left)
- Use File->Import File (I), navigate to your MDK project’s Object directory, highlight the .axf file and click Select File to Import.
- Format should be Executable and Linking Format (ELF), Language should be ARM:LE:32:v8:default. Click OK.
- Note: if you get an error at this point about access being denied to the language file, then you need to run Ghidra with Admin privileges, or move the Ghidra folder to a user-writable location.
- When Import Results Summary window opens, click OK.
- Answer Yes to “… has not been analyzed. Would you like to analyze it now?”
- Ghidra versions before 10.2.2 may require you preload Debug Info Entries: In Analysis Options -> Analyzers, select DWARF, then in Options (on right), check Preload all DIEs (the last box).
- Then select Analyze.
Video showing this process: Ghidra – New Project and Import axf
Basic Navigation
- Use the Functions window to see a list of all the functions identified in the program. These include handlers and threads.
- Clicking on a function in the Functions window brings up the disassembly code in the Listing window, and shows function trees for incoming and outgoing calls.
- Clicking on the
 icon (1+3 green squares, “Display Function Graph”) shows the control-flow graph for the function (not the function call graph).
Get Regions: PC-Sampling Profiler
Most documentation is in the current ESO repository at Tools/GetRegions/Profiling Tools.pdf.
- Profiles without LCD This document shows how to get profile information through the debugger if the LCD is not active or present.
Call Graph Tool
- Must be located in ESA-2?/Tools/Calls
- Requires Graphviz and Python
- Keil MDK-ARM: Target Options
- Linker -> Misc Controls: –callgraph_file=mycallgraph.txt –callgraph_output=text
- Listings -> check Linker Listing box.
- Main repo site to be posted